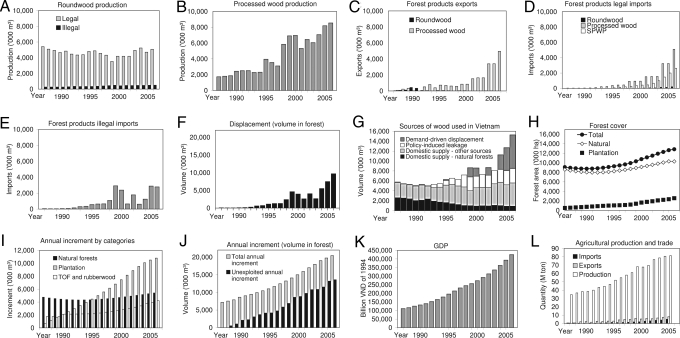
Fig. 2.
Wood flows and other forest-related indicators in Vietnam, 1987–2006. Displacement and annual increment are in volume in forest (RWE volume × 1.2), other wood quantities are in RWE volume. (A) Domestic industrial roundwood production (legal and illegal). (B) Processed wood production. (C) Forest products exports (roundwood, processed wood, and SPWP). (D) Forest products legal imports (roundwood and processed wood). (E) Forest products illegal imports. (F) Displacement of wood extraction into foreign countries. (G) Sources of wood used in Vietnam, 1987–2006. Harvests from natural forests and from other sources (forest plantations, scattered trees, rubberwood) form the domestic supply. Policy-induced leakage and demand-driven displacement form the total displacement. (H) Forest cover (natural and plantations). (I) Annual increment in wood volume per sources. (J) Annual increment in commercially exploitable growing stock in Vietnam's forests, total and unexploited fraction. (K) Gross domestic product (GDP) in constant Vietnam Dong of 1994 from www.econstats.com. (L) Total production and trade (imports and exports) of agricultural products from FAOSTAT (faostat.fao.org). Production include only primary (nontransformed) crops.

