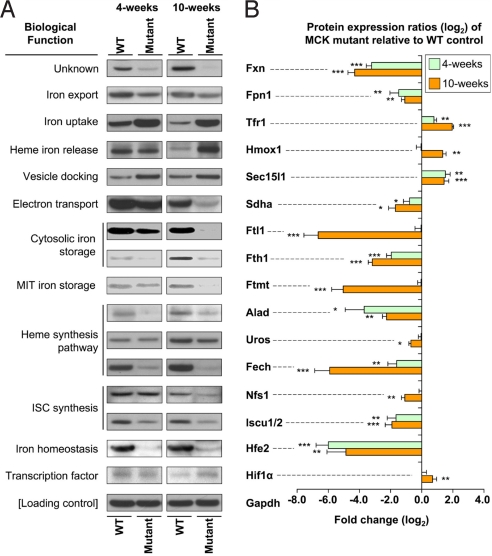
Fig. 3.
Western blot analysis of significantly (P < .05) differentially expressed iron metabolism–related genes and densitometric analysis from 4- and 10-week-old WT and mutant (Fxn knockout) mice. (A) Western blot confirming the differential gene expression from the RT-PCR analysis shown in Fig. 2. (B) Densitometric analysis. *, P < .05; **, P < .01; ***, P < .001. Results shown in (A) are representative of 3–6 experiments, and those in (B) are the mean ± SD of 3–6 experiments.

