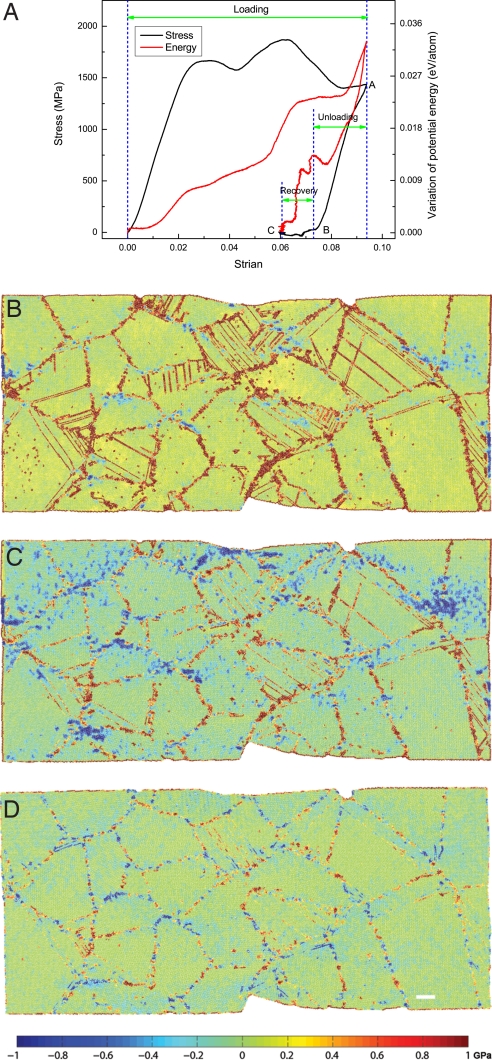
Fig. 2.
Representative behaviors of plastic deformation in an nc Al sample with a mean grain size of d = 20 nm at 300 K. (A) Stress-strain curve and relevant energy evolution. (B–D) Stress contours (σ11) at points “A,” “B,” and “C” marked in Fig. 2A, respectively. (Scale bar, 5 nm.)

