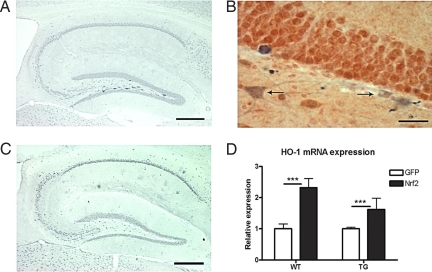
Fig. 2.
LV-Nrf2 increases neuronal HO-1 expression 6 months after gene transfer. (A) Representative photomicrograph of HO-1 immunoreactivity in a brain section of a mouse injected with LV-Nrf2. Intense HO-1 staining is localized to the region of transgene injection. (Scale bar, 100 μm.) (B) Representative photomicrograph of a brain section from a LV-Nrf2-injected mouse, double labeled by HO-1 (in blue) and NeuN (in red). Neurons are the primary HO-1-positive cell type. Arrows point to overlaid staining with the two antibodies. (Scale bar, 50 μm.) (C) Representative photomicrograph of HO-1 immunoreactivity in a brain section of a mouse injected with LV-GFP. (Scale bar, 100 μm.) (D) Increased mRNA expression of HO-1 in hippocampus of mice administered LV-Nrf2. HO-1 mRNA level is expressed as mean fold change normalized to ribosomal RNA ±SEM (2-way ANOVA; ***, P < 0.001; n = 6 for WT-GFP and WT-Nrf2, n = 3 for APP/PS1-GFP, n = 5 for APP/PS1-Nrf2).

