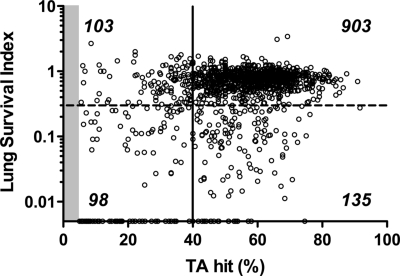
Fig. 2.
Comparison of transposon insertions in the mutant library before and after selection in the lung model. Insertion sites in the 5′ 5–80% protein coding sequence of the gene and reads associated with these sites were considered for fitness analysis. The saturation of transposon insertions within 1,239 genes in the input library is shown on the x axis. Saturation was calculated as the percentage of sites within a gene sustaining transposon insertions to the total number of possible of insertion sites (TA dinucleotides). The lung survival index (s.i.) is represented on the y axis as the number of reads mapped to a gene in the output library divided by the reads identified in the input library (points on the x axis represent s.i. values of zero). Essential genes, those sustaining insertions in <5% of possible sites, are not shown (shaded); the majority of these sustained no insertions, and the remaining 25% averaged 1 insertion per gene. The threshold for an inferred in vitro growth defect (solid line) was set at a saturation of 40% of the possible TA insertion sites within a gene. The threshold for in vivo attenuation (dashed line) was set at a lung s.i. of <0.30. Numbers of genes falling within each quadrant are indicated.

