Fig. 4.
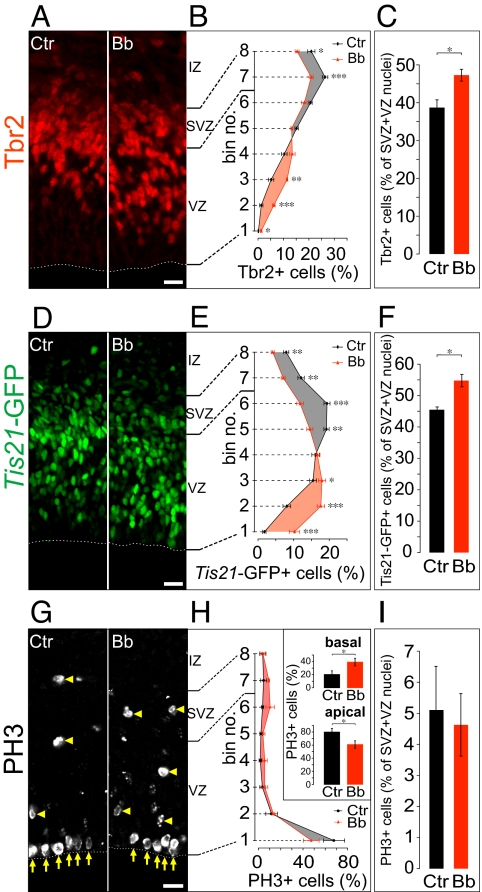
Effects of low-blebbistatin treatment on the distribution and proportion of neurogenic progenitor nuclei in the VZ and SVZ. E14.5 hemispheres from heterozygous Tis21-GFP mice (A–F) or C57BL/6 mice (G–I) were subjected to HERO culture for 24 h in the absence (control, Ctr) or presence (Bb) of 12.5 μM Bb, followed by immunofluorescence for Tbr2 (A), analysis of intrinsic Tis21-GFP fluorescence (D) and phosphohistone 3 (PH3) immunofluorescence (G). Dashed lines in A, D, and G, ventricular surface; yellow arrows and arrowheads in G, ventricular (apical) and abventricular (basal) mitoses, respectively; IZ, intermediate zone. (Scale bars, 20 μm.) (B, E, and H) Distribution of Tbr2-positive (B) and Tis21-GFP-positive (E) nuclei and phosphohistone 3-positive mitotic figures (H) across the VZ plus SVZ (bin analysis as in Fig. 2). Tbr2-positive and Tis21-GFP-positive nuclei and mitotic figures in a given bin are expressed as percentage of the total number of labeled nuclei/mitotic figures in all 8 bins. Black curve and circles, control (Ctr); red curve and triangles, Bb (shading as in Fig. 2). Inset in H: apical, sum of the percentage values of bins no. 1 plus 2; basal, sum of the percentage values of bin nos. 3 to 8. Number of nuclei and mitoses counted are given in Table S2. (C, F, and I) Quantification of Tbr2-positive (C) and Tis21-GFP-positive (F) nuclei and phosphohistone 3-positive mitotic figures (I), expressed as percentage of total nuclei in the VZ plus SVZ as revealed by DAPI staining. Number of DAPI-stained nuclei counted are given in Table S2. (B, C, E, F, H, and I) Data are the mean of 4–7 hemispheres; bars indicate SEM; *, P < 0.05; **, P < 0.01; ***, P < 0.001.

