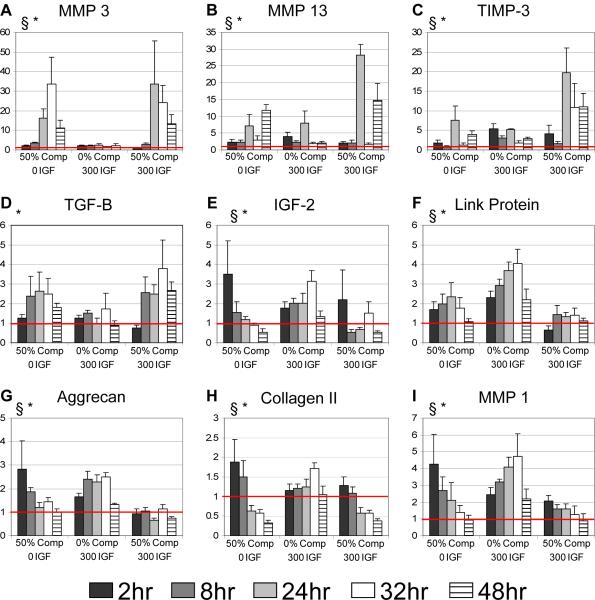
Figure 2.
Gene expression of proteinases, growth factors, and ECM molecules. 8 cartilage disks were pooled for each time point for each experiment. All genes were normalized to 18s and plotted relative to 0%-compression 0 IGF-1. Significance of the fixed effects from the mixed model were calculated. § denotes a significant effect of IGF-1 on gene expression; * denotes a significant effect of compression on gene expression. (p-values < 0.05) Mean ± SE (n=4 animals)

