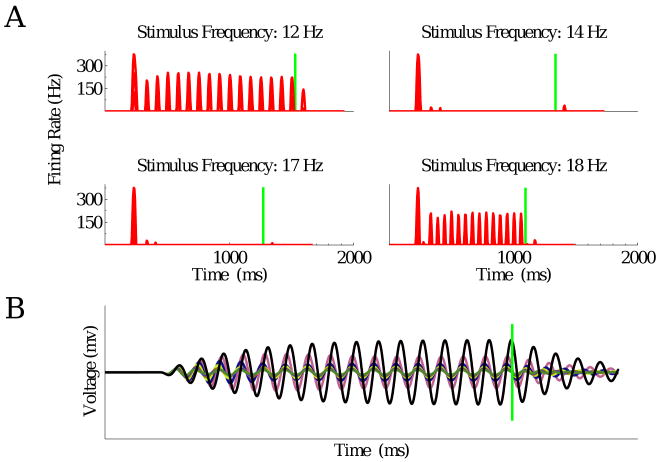
Figure 11.
A: Responses of the resonator bank model to different stimuli. Vertical green lines represent timing of expected flashes. See text for discussion. B: Voltages of different bipolar cell terminals in a resonator bank model in response to a sequence of dark flashes at 12 Hz. Black line represents voltage of the terminal whose resonant frequency is 12 Hz.

