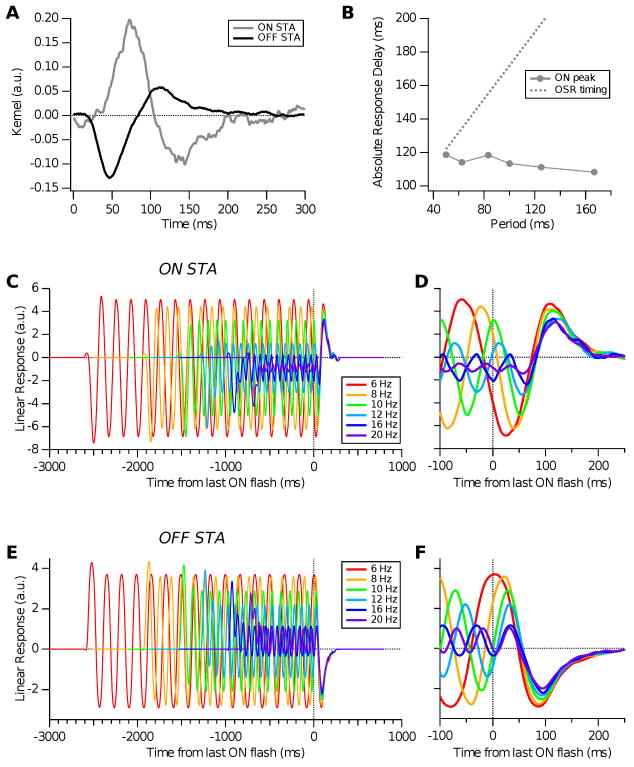
Figure 14.
Dual LN Model. A: ON- and OFF-type spike-triggered averages (STAs) for a salamander retinal ganglion cell. B: Time of peak excitation from ON STA (grey circles) plotted versus stimulus period, compared with perfectly predictive OSR latency (dotted), equal to the latency of each eigenmode's extremum (panel A) plus the stimulus period. C, D: Linear response of the ON STA for different stimulus frequencies (colors) over the stimulus period and expanded near its end. E, F: Linear response of the OFF STA for different stimulus frequencies (colors) over the stimulus period and expanded near its end.

