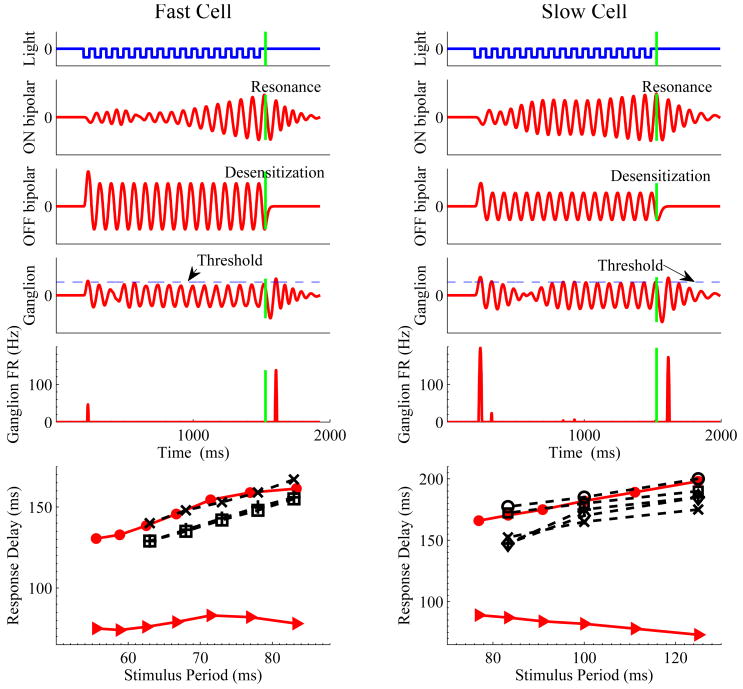
Figure 7.
Simulations of the OSR and latencies for the fast (left) and slow (right) filters of Fig. 4, with high and low frequency parameter sets respectively. Panels from top to bottom show light intensity, ON and OFF bipolar cell voltages, ganglion cell voltages, and ganglion cell firing rates in response to 12 Hz stimuli; vertical green lines indicate omitted flash onset. Bottom panels show latencies from last flash to OSR for the models (solid red, filled circles) and for data from eight ganglion cells (dashed black, crosses, pluses and open symbols). Solid triangles show latencies from omitted flash onset to peak OSR for models.

