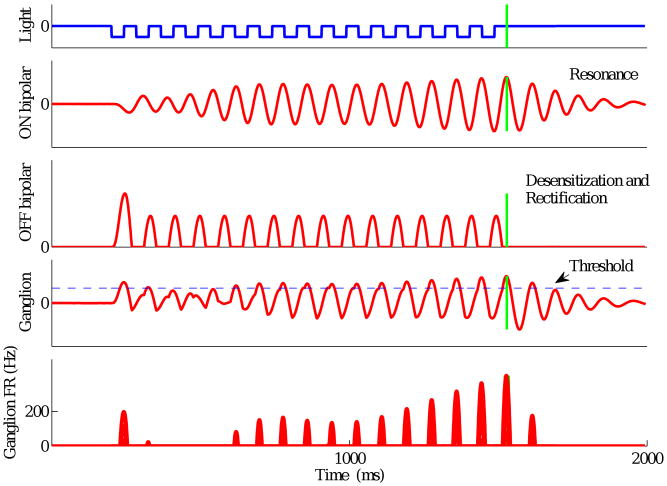
Figure 8.
Model response with slow filter and low frequency parameter set to a 12 Hz stimulus when OFF pathway output UOFF(t) is rectified prior to summation with ON pathway output UON(t). Panels from top to bottom show light intensity, ON and OFF bipolar cell outputs, ganglion cell voltage, and ganglion cell firing rate; vertical green lines indicate omitted flash onset.

