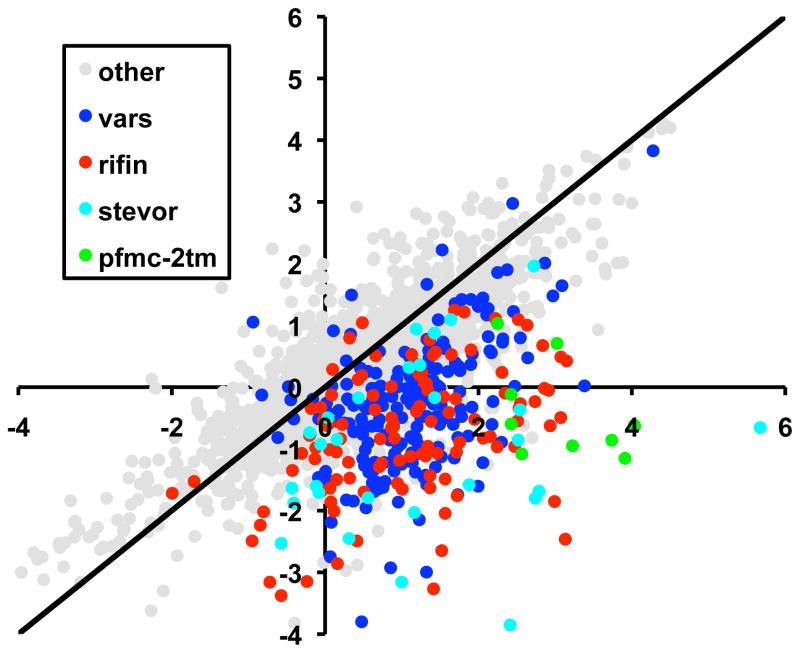
Figure 3.
Downregulation of expanded subtelomeric gene families when selecting for increased copy number of the pVBH plasmid using high blasticidin concentrations. The ratios of transcript signals obtained by DNA microarray under no versus 10 μg/ml blasticidin are plotted. In gray are the intensity values for all genes excluding members of the var, rifin, stevor and Pfmc-2tm gene families. Overall, transcript levels intensities remain unchanged under drug selection and are evenly distributed around a line with a slope = 1 (black). However, the majority of the var, rifin, stevor and pfmc-2tm show a clear decrease in intensity upon selection with 10 μg/ml blasticidin. Both axes represent log2(Cy3/Cy5) intensity values.

