Figure 6.
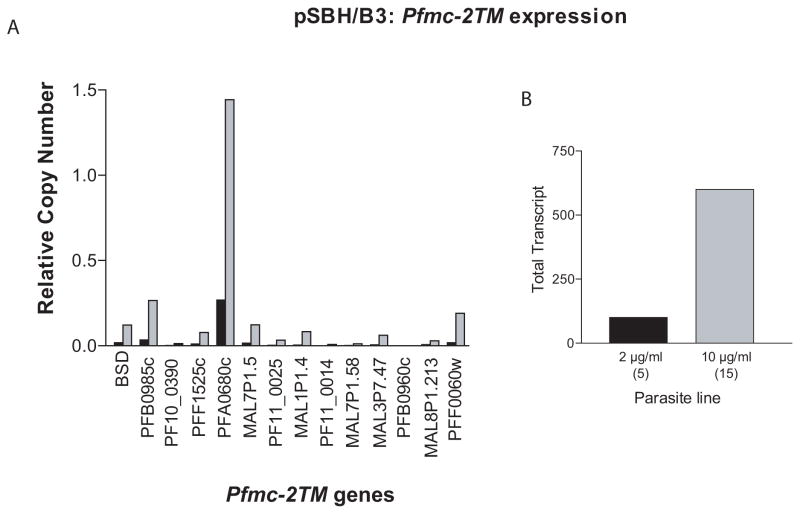
pSBH upregulates Pfmc-2TM expression. (a) Expression levels of endogenous Pfmc-2TM genes in pSBH/B3 parasites under low (black bars) and high (grey bars) blasticin doses. (b) Representation of data depicted in (a). Total Pfmc-2tm transcript levels of pSBH transfected B3 parasites under low (black bar) and high blasticidin doses (grey bar). The approximate copy number of the transfected episome for each drug concentration is shown in parentheses. RNA was harvested at 28 hpi and relative copy numbers were measured with respect to the control housekeeping gene P100-actin (PFL2215) using the formula 2−ΔΔCT with NF54 gDNA as the calibrator.

