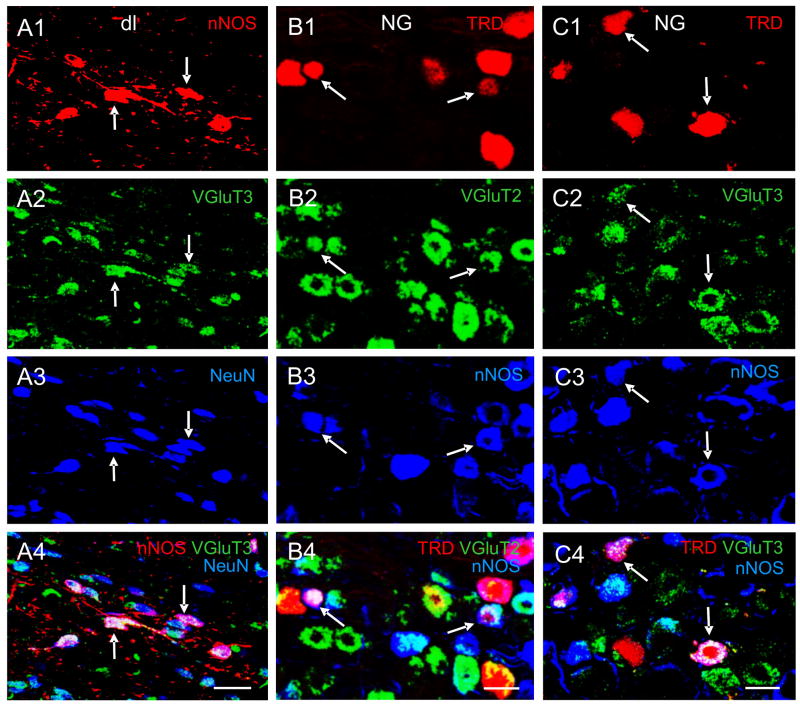
Fig. 2.
Pseudo-colored confocal images showing multiple-label immunofluorescent staining of NTS cells in the dorsolateral subnucleus (dl) subnucleus of the NTS and the NG. A1–A4: A merged image (A4) of the dl demonstrates cells labeled for nNOS (red, A1), VGluT3 (green, A2), NeuN (blue, A3). Neurons that are triple-labeled appear white, as indicated by arrows. B1–B4: A merged image (B4) showing NG cells triple-labeled (indicated by arrows) for TRD (red, B2), VGluT2 (green, B2) and nNOS (blue, B3). C1–C4: A merged image (C4) demonstrating NG cells triple-labeled (indicated by arrows) for TRD (red, C1), VGluT3 (green, C2) and nNOS (blue, C3). Scale bar = 20 μm. Data were extracted from previous publications (Lin and Talman, 2005a; Lin and Talman, 2006) with permission.

