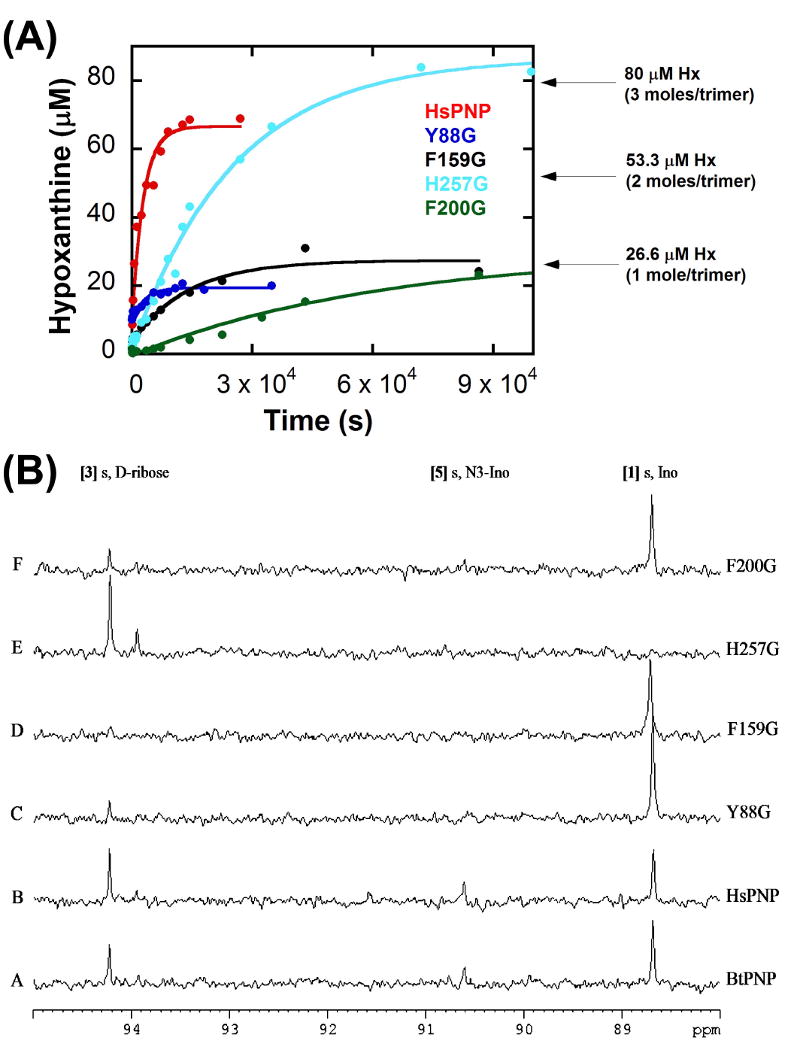
Figure 6. Hydrolysis reactions under high enzyme concentrations.

(A) Single-turnover hydrolysis reaction kinetics, plotting the concentration of hypoxanthine (isolated on a C18 analytical column by reversed-phase HPLC) formed during the hydrolysis reaction of native ( ), Y88G (
 ), F159G (
 ), H257G (
 ), and F200G human PNP (
 ) as a function of mixing time prior to acid quenching. Data were fit to equation (1).
(B) 13C NMR spectra of the PNP hydrolysis reactions. [1′-13C]inosine (900 μM) with (A) native bovine PNP (BtPNP), (B) native human PNP (HsPNP), (C) Y88G, (D) F159G, (E) H257G, and (F) F200G. All spectra were acquired after 20 h at 25 °C with 200 μM PNP in 10% D2O. [1] Ino, inosine; [3], d-ribose; [5] N3-Ino, N3-isoinosine.
