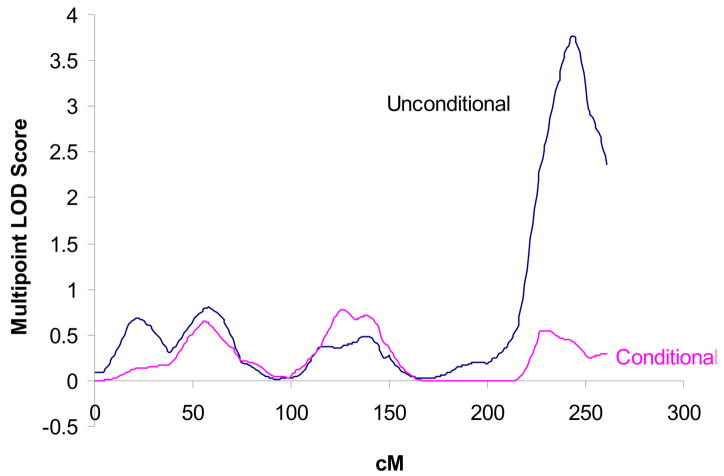
Figure 1.
Multipoint LOD scores for serum bilirubin of the original linkage scan (unconditional) (10) and the conditional (combined linkage/disequilibrium analysis) linkage scan on chromosome 2. After adjusting for bilirubin variance explained by the UGT1A1 TA-repeat polymorphism, the LOD score on chromosome 2q dropped from 3.8 to 0.4 confirming that this polymorphism explains the previous linkage findings. X-axis values are cM. Y-axis values are multipoint LOD scores.

