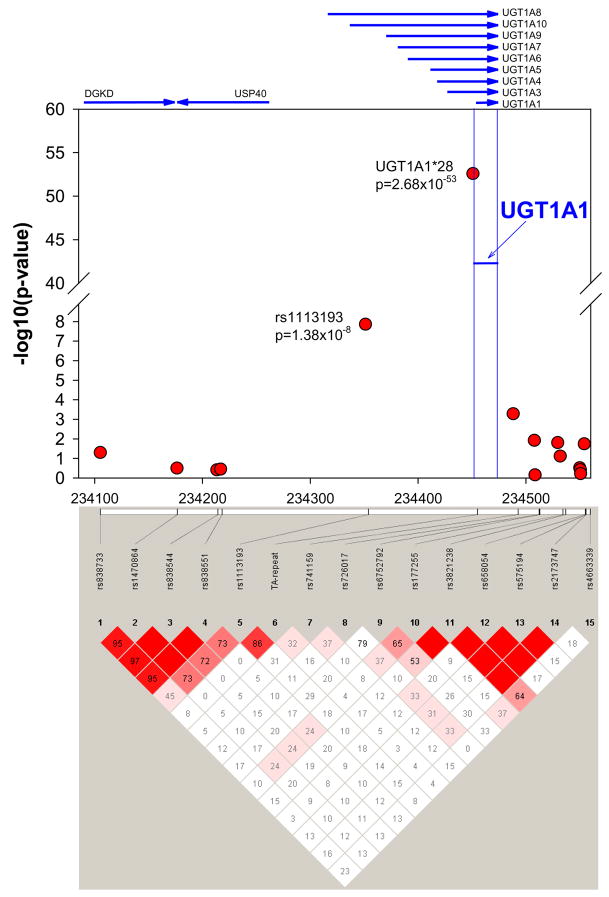
Figure 2.
P-values of 14 genotyped SNPs from the genome-wide association study and the TA-repeat (UGT1A1*28) polymorphism within the promoter of UGT1A1. P-values for the genome-wide association study SNPs were calculated using a linear mixed effects model (LME). The figure illustrates the lowest p-value from the two examinations. Chromosomal position were taken from HapMap (NCBI build 36, dbSNP b126). The blue lines show the boundaries of the UGT1A1 region. The lower panel provides the linkage disequilibrium pattern (D′, Haploview 4.0).

