
Fig. 10.
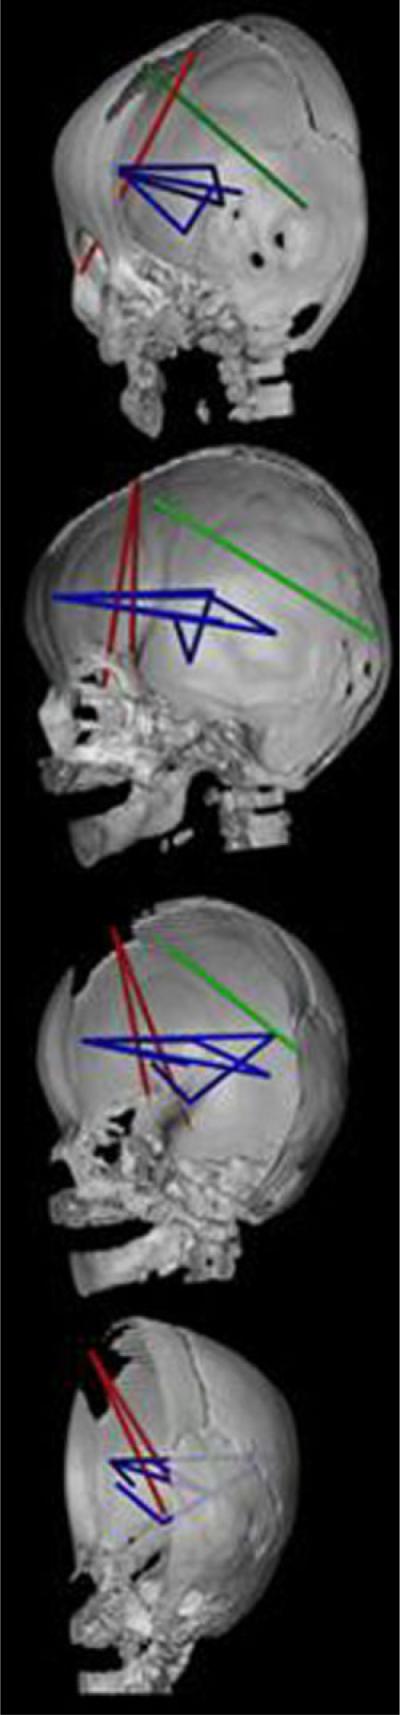
CT reconstruction of the skull (right half of skull and mandible shown) to show distances on the skull (in red) and the brain (in blue and green) that are associated differently in RUCS and SS. Orientations of the views are the same as those in Figure 7. This figure depicts those measures of the brain that are significantly more strongly associated with two measures of the anterior cranial vault shown in red: RPTNP-to-BRG and RFZJ-to-BRG. Linear distances among neural landmarks shown in blue are more strongly associated with both skull measures in RUCS. The single measure of the brain shown in green (RFSS-to-ROP) is more strongly associated with RFZJ-to-BRG. Refer to text for further discussion.