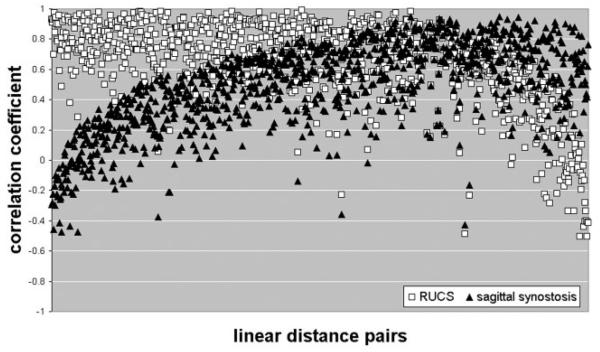
Fig. 4.
A plot of the elements of the correlation matrices for our two samples. The magnitudes of the raw correlation coefficients are plotted on the Y-axis, while the LDPs are on the X-axis. Each open square represents the correlation coefficient for a pair of linear distances measured on the RUCS sample, one measured on the brain and another measured on the skull. Correlation coefficients for pairs of linear distances measured on SS are designated by closed triangles. The measurement pairs are sorted from left to right in terms of the magnitude of the differences in correlation between the samples, thus the correlations for the two synostosis groups are plotted in the same order. An interactive version of this figure is available on our laboratory website (http://getahead.psu.edu) which allows the user to point to any given symbol and the value for any specific LDP is provided.

