
Fig. 9.
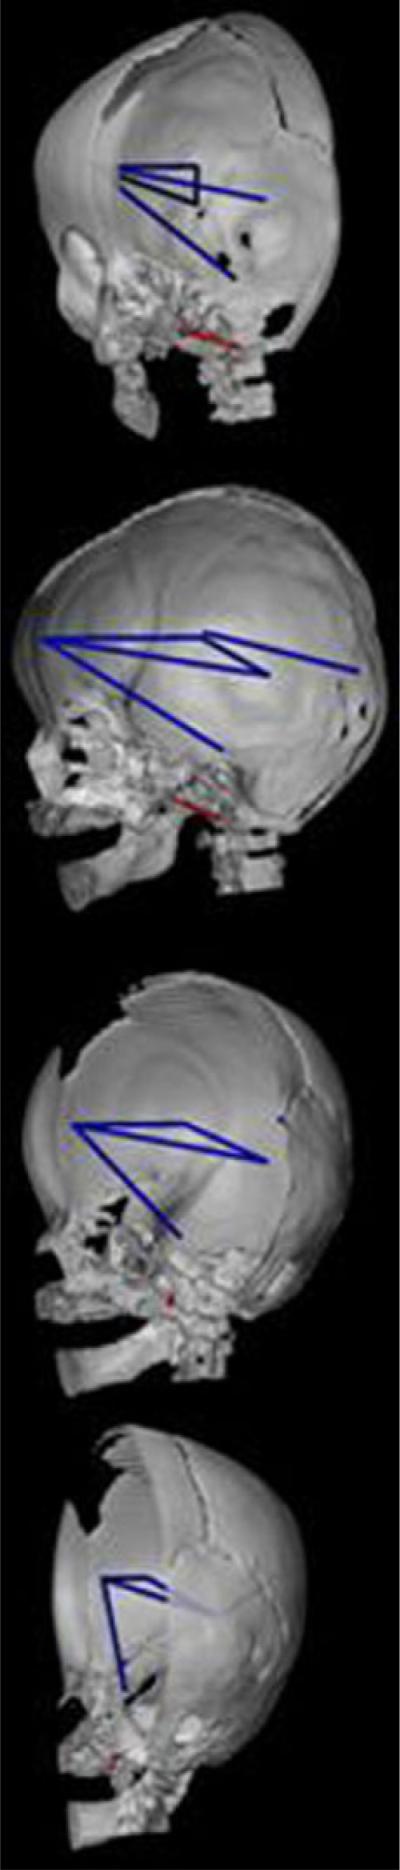
CT reconstruction of the skull (right half of skull and mandible shown) to show distances on the skull (in red) and the brain (in blue) that are associated differently in RUCS and SS. Orientations of the views are the same as those in Figure 7. This figure depicts those measures of the brain that are significantly more strongly associated in RUCS with a single measure of the cranial base shown in red: RFOV-to-BAS.