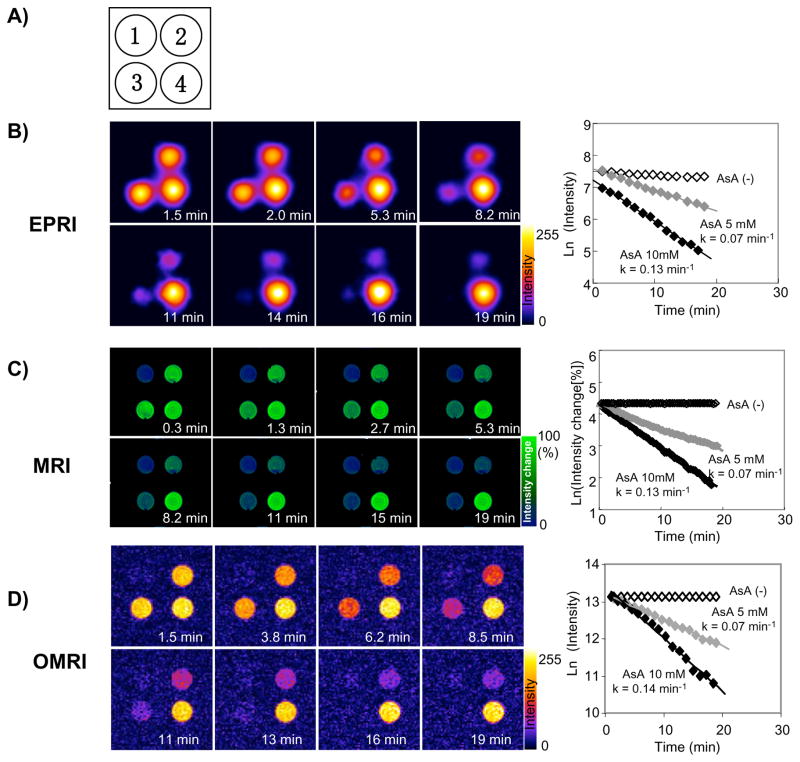
Figure 5.
Comparison of image intensity decay among three modalities. A) Schematic of the phantoms: Tube 1, PBS; Tube 2, 2 mM 3CP and 5 mM AsA; Tube 3, 2 mM 3CP and 10 mM AsA; Tube 4, 2 mM 3CP. Time course images and decay slops of B) EPRI, C) MRI, D) Overhauser MRI (OMRI) were obtained. After addition of AsA/PBS solution, the EPRI or OMRI measurements were started immediately and continuously measured up to 20 min. In the case of MRI, AsA/PBS was added using PE-10 tube 2 min after scanning was started. Therefore, time zero in the MRI experiment represents the time at addition of AsA solution. The experiments were repeated three or four times using with freshly prepared solutions. Semi-logarithmic plots of the time course of MRI signal change in the region of interest (ROI: 10 ×10 pixels) were used for decay rate calculation using imageJ software. Decay rate constants were obtained from the slope of linear portion of the decay curves. (Adapted with permission from reference Hyodo et al 2008)

