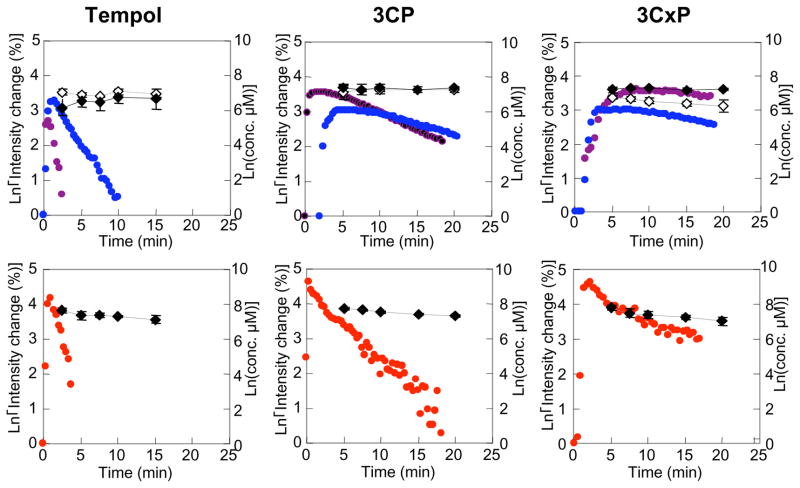
Figure 7.
The pharmacokinetics of oxidized form and total (oxidized and reduced form) nitroxide contrast agents in normal leg muscle, tumor, and blood. The pharmacokinetics of oxidized form of (A) Tempol, (B) 3CP, (C) 3CxP in normal tissue (blue), tumor tissue (purple), and artery (red) were obtained by SPGR MRI. The total nitroxide contrast agent concentration of (A) Tempol, (B) 3CP, (C) 3CxP in normal tissue (upper figure, gray), tumor tissue (upper figure, black) and blood (lower figure. black) were measured ex vivo by x-band EPR spectroscopy using 10 mM ferricyanide/PBS solution (final concentration was 2 mM). (Adapted with permission from (Hyodo et al 2006))

