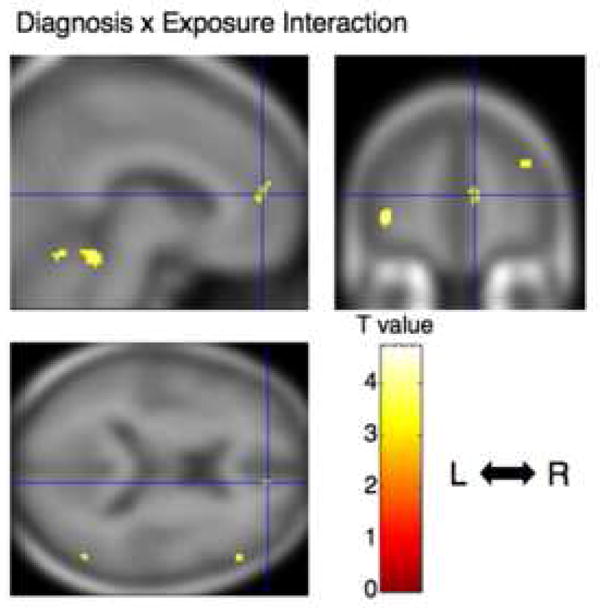
Figure 2. Brain region showing PTSD Diagnosis × combat Exposure interaction.

Regional interaction for gray matter density in pregenual anterior cingulate cortex is rendered onto orthogonal slices of the averaged magnetic resonance image of the present study’s subjects. Cross hairs indicate the peak coordinate of the interaction ([ 8 50 12]). Abbreviations: L: left hemisphere, R: right hemisphere.
