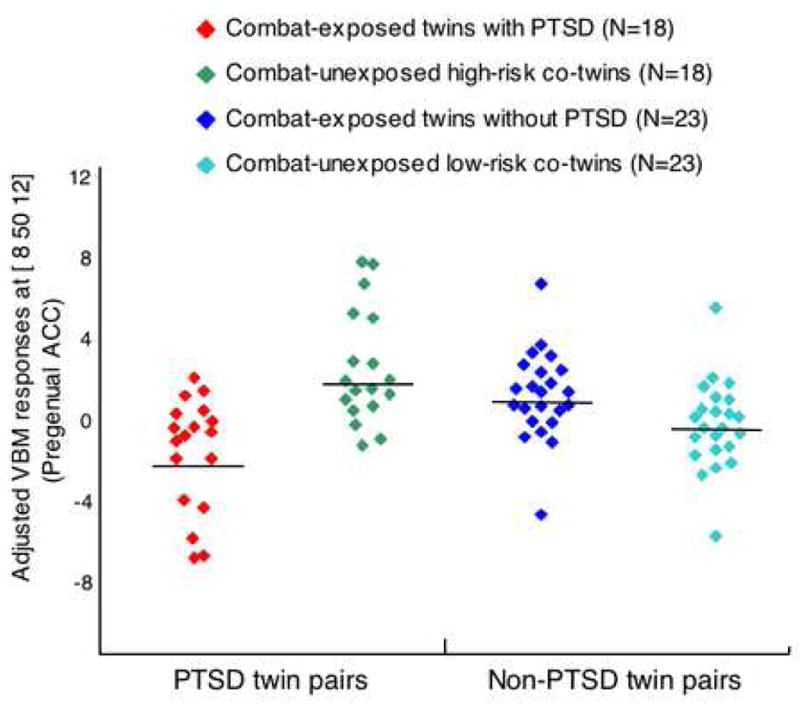
Figure 3. Scatterplots of individual subjects’ adjusted VBM responses.

Shown at the site of the PTSD Diagnosis × Combat Exposure interaction in pregenual anterior cingulate cortex ([ 8 50 12]). Means are represented by solid horizontal lines drawn on each group’s distribution.
