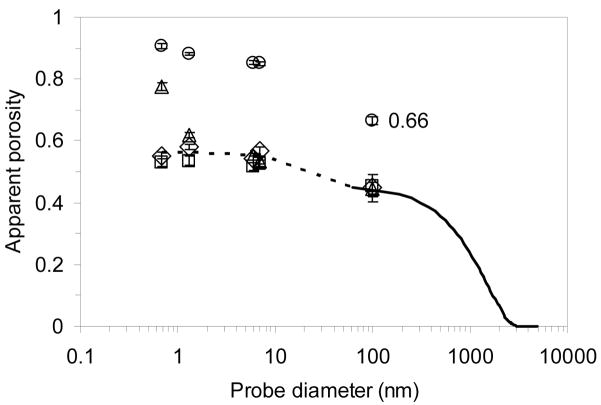
Figure 1.
Experimental ε as a function of bioparticle diameter for CIM (◇), ProSwift (□), Uno Q (△), and PL-SAX (○); ε for CIM calculated from SEM images (––––). The range for the curve calculated from the SEM images is limited by resolution of the images, so it was extended (- - - -) using the chromatographic ε data. Two extension points were added: one is an average of the small molecule data and the other is an average of the protein data for this stationary phase. The experimental ε values shown are averages of the ε values at different flow rates. Error bars represent one standard deviation (n=7). The data label on one of the data points emphasizes that the virus is able to penetrate into the pore space of the perfusive resin under non-interacting conditions.

