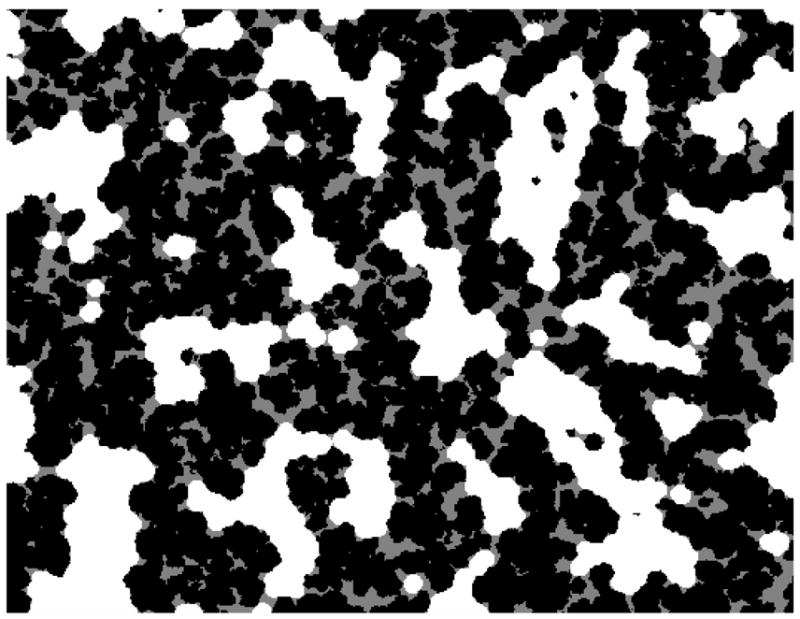
Figure 3.

Example of an ε calculation using the binarized SEM image from Figure 2. Black areas are the solid polymer matrix, white areas are the accessible pore space for an arbitrary probe diameter of 0.66 μm, and grey areas are inaccessible to this probe size. Same image dimensions as in Figure 2 (32 × 26 μm).
