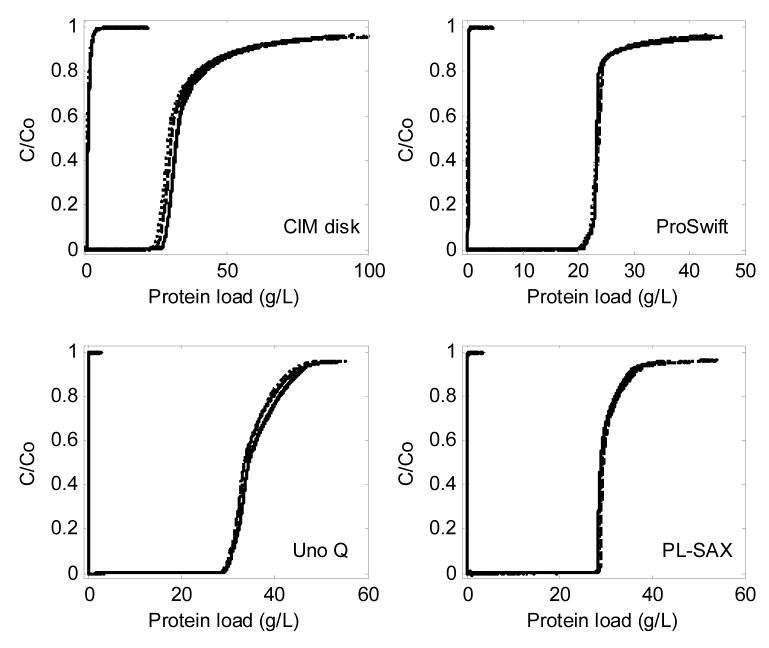
Figure 9.
BSA breakthrough curves on the four stationary phases, along with no-column controls. The three different flow rates, slowest (–––), intermediate (– – –), and fastest (· · · · · · · ·), are: 0.8, 2.4, 4.1 cm/min for CIM; 2.8, 5.6, 8.3 cm/min for ProSwift; 2.4, 4.8, 9.6 cm/min for Uno Q; 2.3, 4.7, 9.4 cm/min for PL-SAX. The linear flow rates differ somewhat between the stationary phases because this practice reduced the number of necessary control runs and the maximum volumetric flow rate was also limited by the loading pump. Mobile phase: 20 mM HEPES, pH 7.8. C0 = 2.5 g/L BSA.

