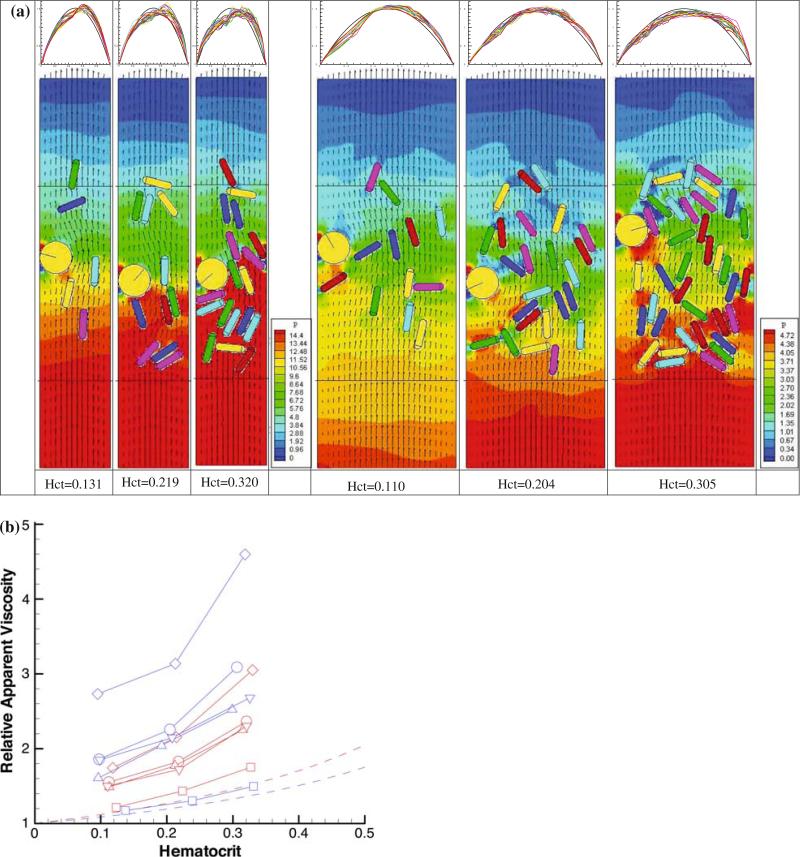
FIGURE 3.
(a) WBC adhesion affects flow resistance through 20 μm (left) and 40 μm (right) channels. Flow is from bottom to top. The hematocrit for each simulation is given at bottom, and the velocity profiles across the channel at various time points are shown at top. The WBC is the yellow disk, and the RBCs are the colored capsules; background color corresponds to the local fluid pressure and the small arrows correspond to the local fluid velocity. Note the build-up of pressure behind the rolling WBC (red color), which is greater at higher hematocrit and smaller channels. (b) Relationship between relative apparent viscosity and hematocrit. The solid lines represent the data from Ref. 54. Red represents the 40 μm tube and blue the 20 μm tube (reproduced with permission from Ref. 67).

