
Figure 1.
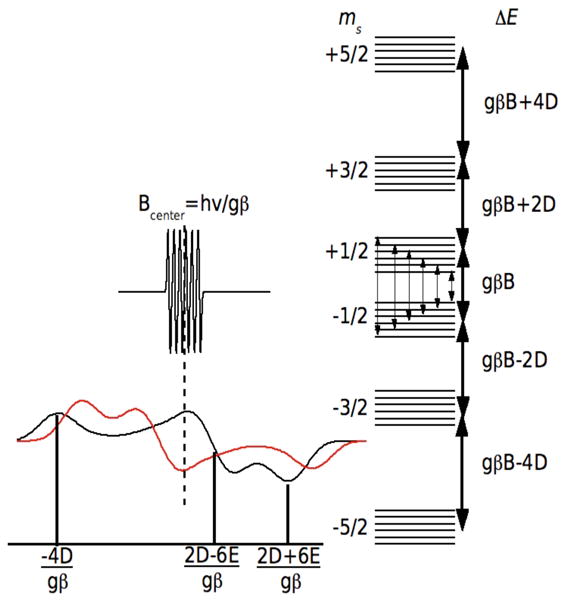
The EPR spectra (left) and energy levels (right) of a Mn(II) ion when the Zeeman interaction (gβB) is the dominant interaction. The energy diagram is for the case where E=0 and the heavy arrows denote the five formally allowed electronic spin transitions. The powder spectrum of the ms=−5/2 →−3/2 transition is shown for D < 0 (red) and D > 0 (black). The ms=−1/2 →1/2 spectrum and the associated electron-nuclear hyperfine transitions (fine arrows) are also shown. Both, the ms=−5/2 →−3/2 and ms=−1/2 →1/2 spectra are centered Bcenter=hν/gβ. The labeled field positions are relative to Bcenter.