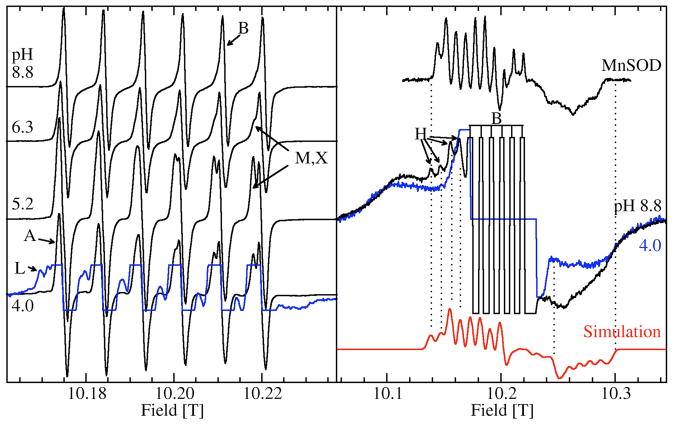
Figure 3.
The pH dependence of the 285 GHz 25 K Mn(II) EPR spectra of the ms=−1/2→1/2 transition of JIC-OxdC. The left panel shows narrow field range spectra of the six hyperfine resonances associated with A, B, M, X and L and a ×8 expanded spectrum (blue trace) of the pH 4.0 spectrum shows the more complex features of L. The right panel shows spectra of the pH 8.8 (black) and 4.0 (blue) samples obtained with a ×4 broader field sweep. The truncated six lines of the pH 8.8 spectrum correspond to the six lines seen in the corresponding spectrum on the left panel. Similar six-lines in the pH 4.0 spectrum have been suppressed for clarity. The broad underlying features common to both pHs are due to the ms=−5/2→−1/2 and ms=−3/2→−1/2 transitions. The four indicated left-most hyperfine features belong to H (black) and are not present at low pHs (blue). A simulation (red) based on these four features as well as the edge positions marked by the two dotted lines on the high-field side of the spectrum is also shown. For comparison, the spectrum of the ms=−1/2→1/2 transition of the pentacoordinated Mn(II) center in E. coli MnSOD is also shown.

