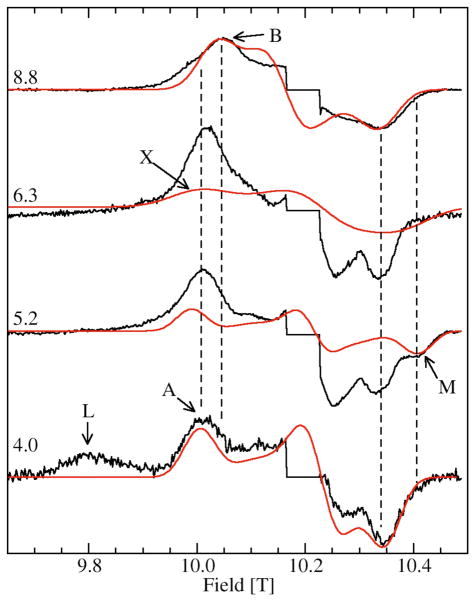
Figure 4.
The pH dependence of the ms=−5/2→−3/2 of the 285 GHz 4 K Mn(II) EPR spectra of JIC-OxdC. The sharp central six line features corresponding to the ms=−1/2→1/2 transitions have been suppressed. The red traces are the simulations of the features indicated, except for the simulation of L which is shown in Figure 5. The two vertical dashed lines between 10.00 and 10.05 T indicate the shift in field positions of the A and B components (see Figure 6) and the two between 10.35 and 10.45 T, the position of the shifted high-field edge of M relative to the other site-2 components.

