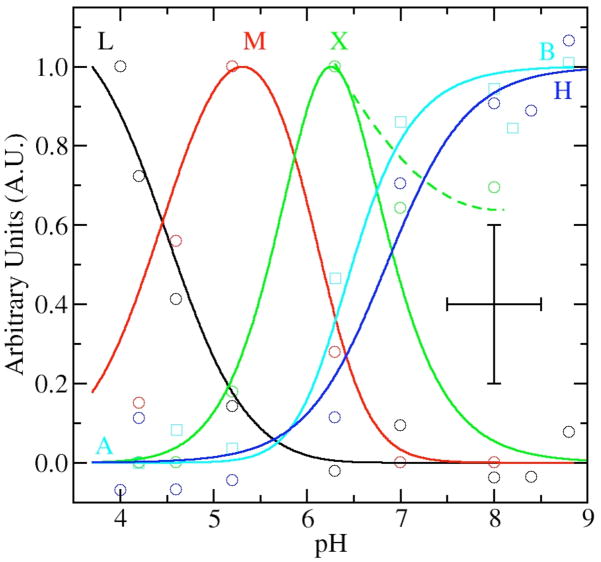
Figure 6.
The pH dependence of selected spectral features as a function of pH: the L component in the 4 K spectra (black circles); the 25 K H resonance (blue circles); the 4 K M component (red circles); X contribution from fits of both 25 and 4 K spectra (green circles); and the shift in field position of the site-1 ms=−5/2→−3/2 contribution (cyan circles, see Figure 4). The corresponding lines are from manual fits of the data using standard speciation equations for triprotic equilibria with pKas at 4.2, 6.2 and 6.3 for site-2 contributions and monoprotic equilibrium curve with a pKa of 6.9 for site-1. The dashed green line shows the trend of experimental X data at high pH. The data and speciation curves have been arbitrarily normalized to unit. The crossed bars give the estimated maximum error in the measurements.

