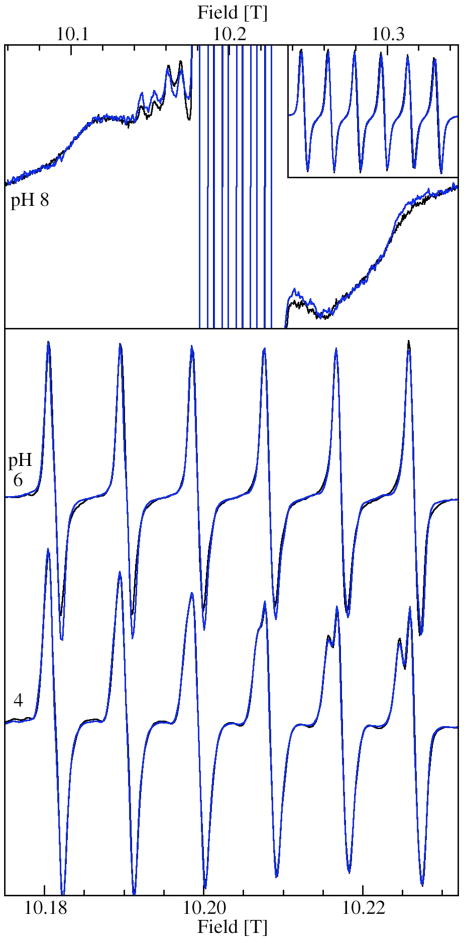
Figure 8.
Comparison of the ms=−1/2→1/2 HFEPR spectra of JIC (black) and UF-OxdC (blue): at pH 8, both in Tris (upper panel); pH 6 UF in HMTA and JIC in citrate; and pH 4 both in citrate (lower panel). The upper panel inset shows the site-1 portions of the spectra that have been truncated in the main panel.

