
Figure 2. Global preferential structural transition network between prototypes.
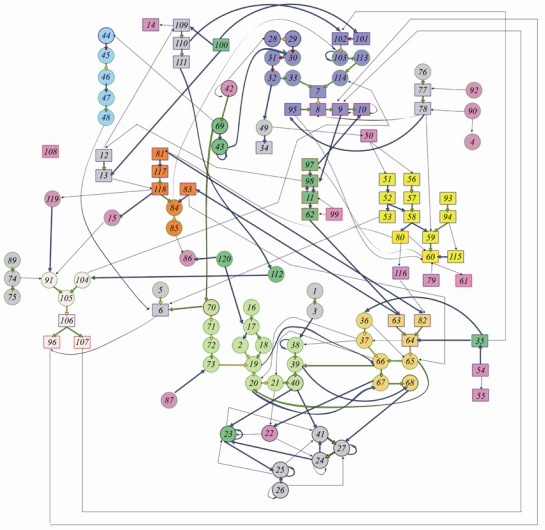
For a better representation, only transitions with a probability greater than 0.15 are shown. These represented transitions, does not represent the whole complexity of the protein structure space but it shows in average 45.56 % (σ ± 22.22) of transitions from a given LSPs to one, two or three others. It takes into account the 51% of the most frequent transitions observed. Actually, each LSP has at least a 0.15 probability to succeed or precede another given LSP. The only exception is the LSP 108.
Transitions with a probability between 0.15 and 0.20 are shown in thin black arrows. Blue, green and yellow arrows show respectively 0.20 to 0.30, 0.30 to 0.50 and 0.50 to 0.70 probability transitions. Red arrows show transitions with probability more than 0.70. Circular nodes with black and green border correspond to helical and connecting LSPs respectively. Rectangular nodes with red and blue border correspond to extended and extended edge LSPs respectively. Seven preferential transition sub-network of LSPs have been defined (see Figure 3). Each node is filled with a color indicating its transition category.