
Figure 3. 7 LSP sub-networks represent significant transition probabilities.
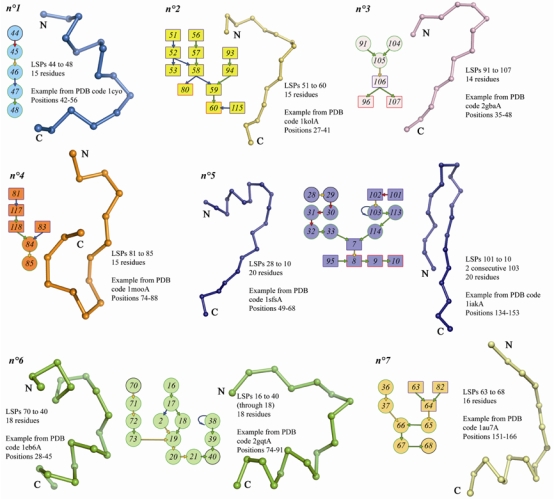
These sub-networks made it possible to assess of the prediction of LSPs involved in frequent super-local protein structures. Examples of these local structures in proteins are given next to the corresponding sub-network. Their position in proteins, their assigned prototypes chain and length are indicated.
Only transitions greater than 0.2 are represented. Blue, green, yellow and Red arrows show 0.2 to 0.3, 0.3 to 0.5, 0.5 to 0.7 and more than 0.7 probability transitions respectively. Circular nodes with black and green border correspond to Helical and Connecting LSPs respectively. Rectangular nodes with red and blue border correspond to Extended and Extended edge LSPs respectively.