
Figure 4. Definition and assessment of a confidence index (CI).
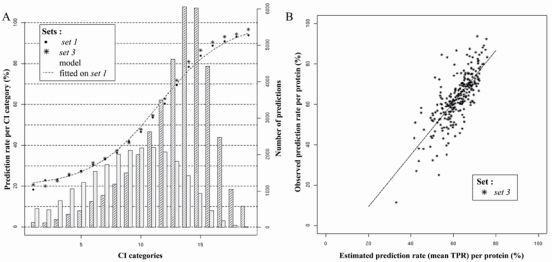
A: representation of the prediction rate associated with each category of CI on set 1 and on set 3. A model of the relation between categories and prediction rate was fitted on set 1 and is shown by a dashed line. The histogram represents the number of correct (dark stripes) and of incorrect (light stripes) predictions for each CI category on set 3. CI Categories numbered from 1 to 19 correspond to the following intervals of SVM outputs: ]−∞, −1.32], ] −1.32, −1.14], ] −1.14, −0.95], ] −0.95, −0.77], ] −0.77, − 0.58], ] −0.58, −0.39], ] −0.39, −0.21], ] −0.21, −0.02], ] −0.02, 0.17], ]0.17, 0.36], ]0.36, 0.54], ]0.54, 0.73], ]0.73, 0.92], ]0.92, 1.10], ]1.10, 1.29], ]1.29, 1.48], ]1.48, 1.67], ]1.67, 1.85], ]1.85, +∞]. B: representation of the prediction rate per protein observed on set 3 according to the mean theoretical prediction rate (TPR) estimated per protein based on to CI values categories. The model corresponding to the linear relation between these 2 variables is shown by a solid line.