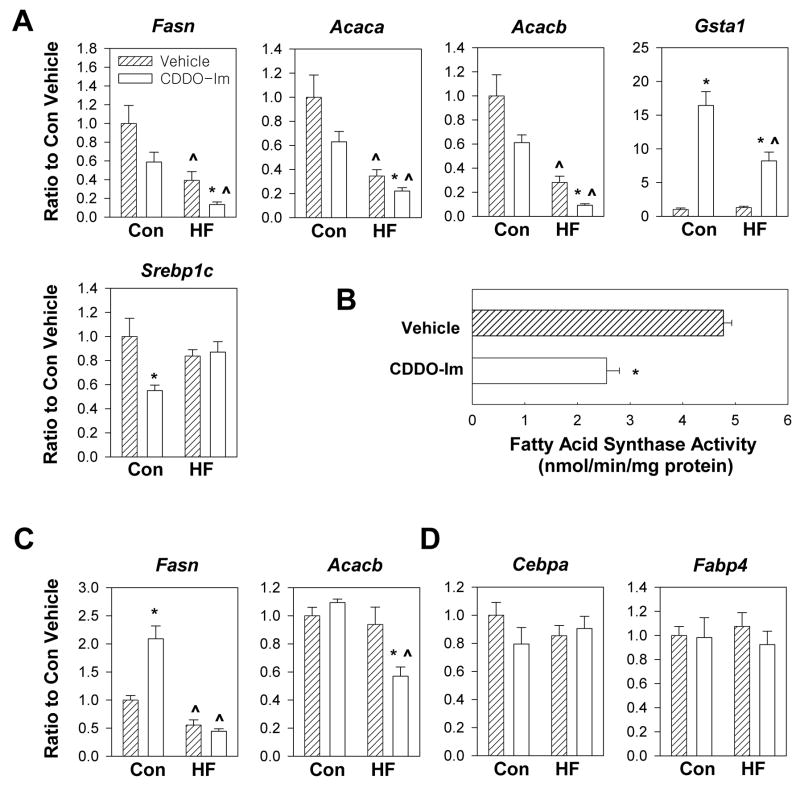
Fig. 4.
Effects of CDDO-Im on gene expression and fatty acid synthase activity in wild-type mice fed a control diet or a high-fat diet for 95 days (A, B, D) or 21 days (C). (A) Analysis of hepatic gene expression using quantitative real-time PCR following 95 days of treatment. Data represent mean ± S.E.M., n = 6–8 per group. * P ≤ 0.05, CDDO-Im vs. vehicle. ^ P < 0.05, high-fat diet vs. control diet. (B) Specific activity of fatty acid synthase in the liver of mice fed a high-fat diet for 95 days (nmol NADPH oxidized per min per mg protein). Data represent mean ± S.E.M., n = 4 per group. * P < 0.05, CDDO-Im vs. vehicle. (C) Analysis of hepatic gene expression using quantitative RT-PCR following 21 days of treatment. Data represent mean ± S.E.M., n = 6 per group. * P < 0.05, CDDO-Im vs. vehicle. ^ P < 0.05, high-fat diet vs. control diet. (D) Analysis of gene expression in white adipose tissue using quantitative RT-PCR following 95 days of treatment. Data represent mean ± S.E.M., n = 6 per group. * P < 0.05, CDDO-Im vs. vehicle. ^ P < 0.05, high-fat diet vs. control diet.

