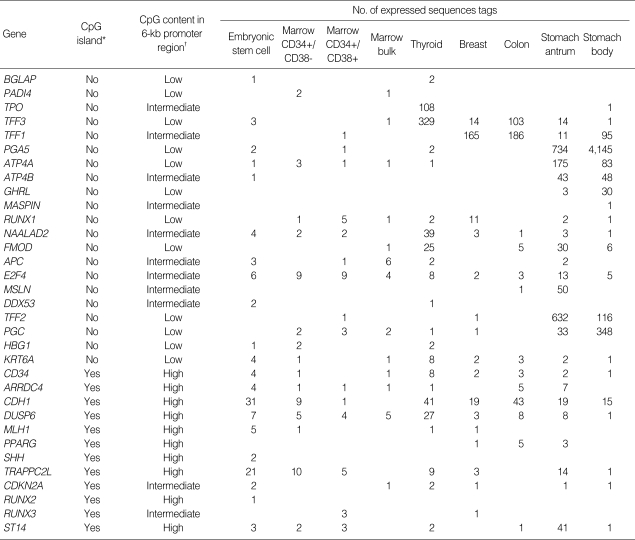
Table 2.
Expression patterns of key tissue-specific genes in pluripotent cells (embryonic stem cell and hematopoietic progenitor cells) and lineage-committed tissues (marrow bulk, thyroid, breast, colon, and stomach)
*More than 50% GC percent, greater than 200 bps length, and over 0.6 ratio of observed to expected number of CpG dinucleotide to the expected G+C number (http://genome.ucsc.edu). The length and position of CpG island are different at each gene; †Classification of CpG content is described in Materials and Methods section.

