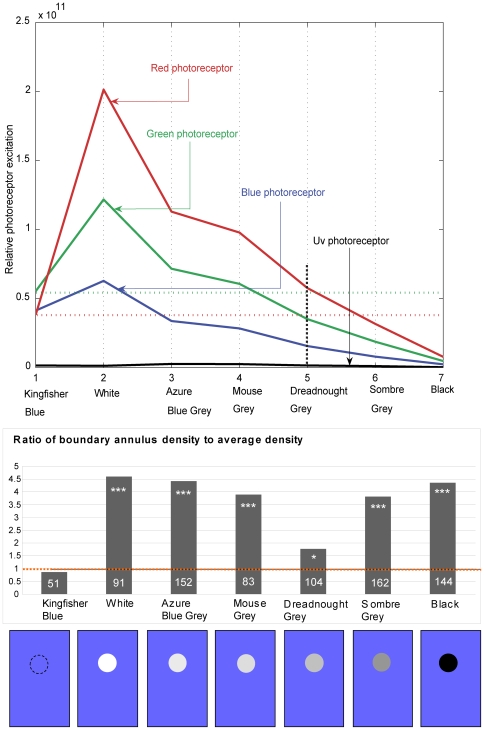
Figure 5. Relative photoreceptor excitations for the various color discs.
Upper panel: The vertical dotted line facilitates reading of the excitations induced by the Dreadnought Grey disc in the red, green, blue and UV photoreceptors, and comparison with the excitations induced in the red and green receptors by the Kingfisher Blue background (horizontal red and green dotted lines, respectively). Lower panel: Values of α obtained for the various grey cards. α is the ratio of the density of the landings in the boundary region (region B in Figure 1B) to the average overall landing density (measured over regions A, B and C in Figure 1B). The data represent a total of 787 landings from 3–6 birds. The number in each bar denotes the number of landings analyzed. (***) indicates that the value of α is highly significantly different from 1.0 (P<0.00005), (*) indicates a marginally significant difference (0.01<P<0.05), and the absence of this symbol indicates that α is not significantly different from 1.0 (P>0.3). A pictorial representation of the various grey discs, as viewed against the blue background, is shown at the bottom of panel B.

