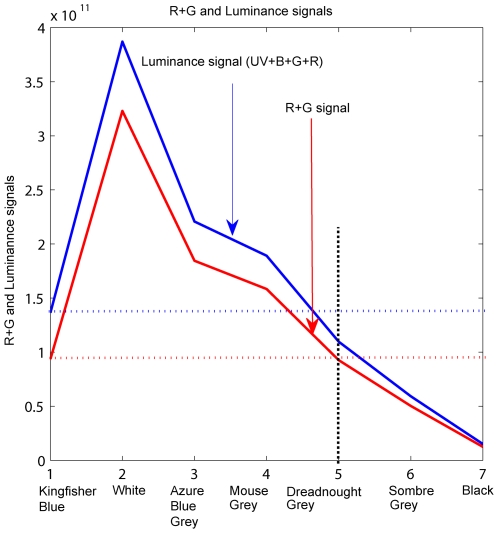
Figure 6. Relationship between the luminance signals for the various colored discs.
Variation of the luminance signal (UV+B+G+R) and the (R+G) signal for the various colored discs, calculated as described in “Methods”. The vertical dotted line facilitates reading of the (UV+B+G+R) signal and the (R+G) signal induced by the Dreadnought Grey disc, and comparison with the corresponding signals induced by the Kingfisher Blue background (horizontal blue and red dotted lines, respectively).

