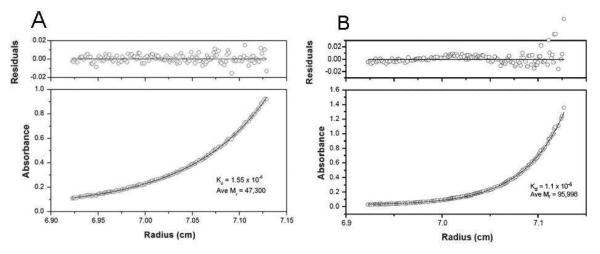
Figure 4.
Sedimentation equilibrium of purified mouse βB1-crystallin and of the mouse βB1- and human βA3-crystallin complex are shown. Panel A. Sedimentation equilibrium of purified mouse βB1-crystallin at 0.6 mg/mL and 20°C. The absorbance (280 nm) gradient in the ultracentrifuge cell after attaining sedimentation equilibrium is shown in the bottom panel. The solid line indicates the predicted monomer-dimer association model, and the open circles represent the experiment values. The top panel shows the difference between the predicted and the experimental values as a function of radial position (residuals). Panel B. Sedimentation equilibrium of the mouse βB1- and human βA3-crystallin complex at 0.6 mg/mL at 20°C. The solid lines indicate the predicted heterodimer-heterotetramer association model, and the open circles represent the experiment values.

