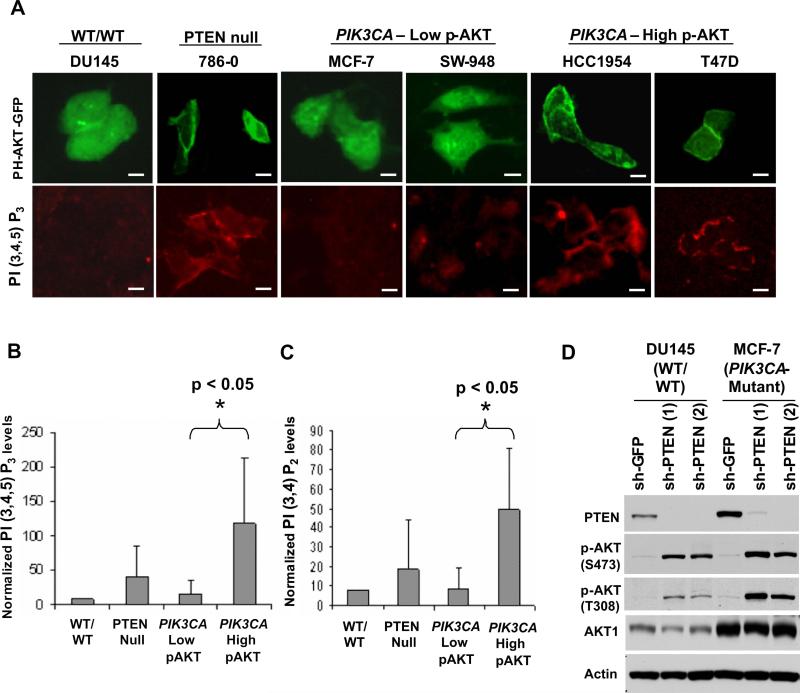
Figure 3.
AKT subcellular localization, phosphatidylinositide studies, and PTEN regulation in PIK3CA-mutant cells. (A) Immunofluorescence studies of transient PH-AKT-GFP expression (top panel) and PI(3,4,5)P3 levels (bottom panel), and are shown for “wild-type” (DU145), PTEN-null (786−0), PIK3CA-mutant cells with low p-AKT (MCF-7 and SW-948) and PIK3CA-mutant cells with high p-AKT (HCC1954 and T47D). Scale bars = 30 μM. (B, C) Relative levels of PtdIns(3,4,5)P3 (B) and PtdIns(3,4)P2 (C) are shown in “wild-type” (DU145), PTEN-null (786−0 and SF-539), PIK3CA-mutant cells with low p-AKT (MCF-7, HCT-15 and SW-948) and PIK3CA-mutant cells with high p-AKT (HCC1954, MDA-MB453 and T47D). Error bars represent standard deviations of the mean for each cell line group. (D) Immunoblot analysis of AKT phosphorylation (p-AKT) at Ser473 and Thr308 following PTEN knockdown in “wild-type” (DU145) or PIK3CA-mutant cells (MCF-7).

