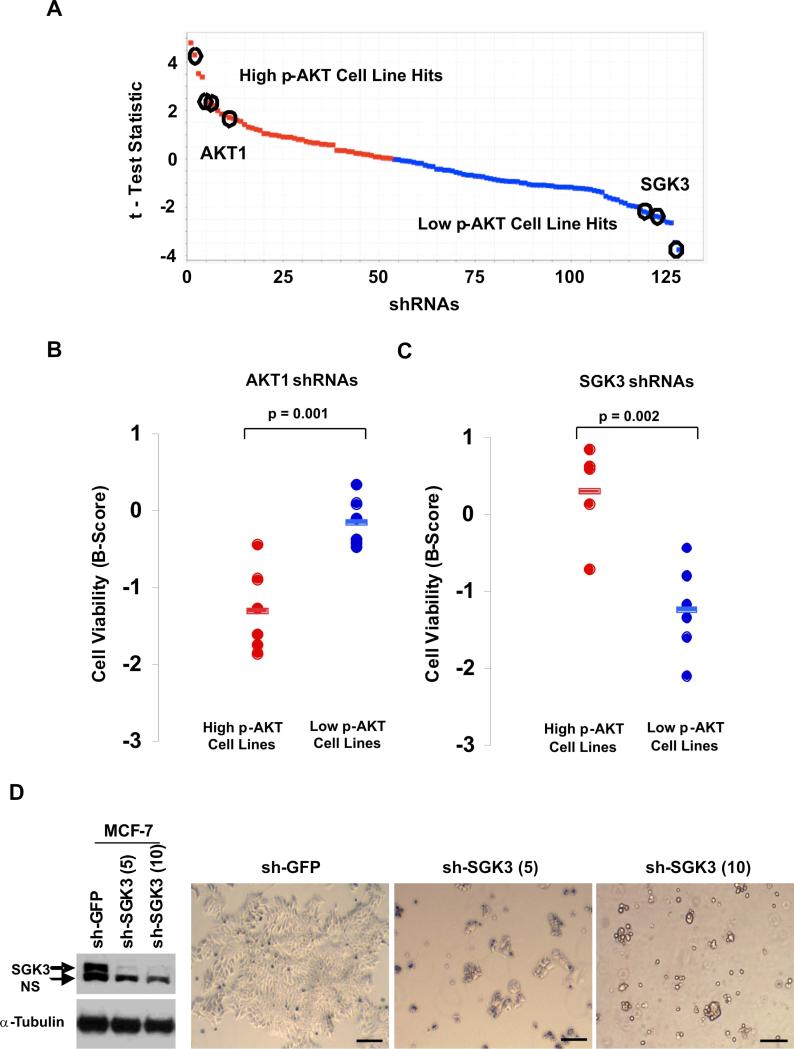
Figure 6.
SGK3 transduces an AKT-independent signal in PIK3CA-mutant cells. (A) Distribution of 120 hairpins against 20 PDK1 substrates ranked according to the t-test statistics applied to cell viability data. The tails of the curve represent hairpins that are selectively lethal in 3 PIK3CA-mutant cell lines with high p-AKT (red) compared to 3 PIK3CA-mutant cell lines with low p-AKT (blue). Multiple hairpins targeting AKT1 or SGK3 in the top 10% of hairpins distinguishing each class are indicated (circles). (B,C) Cell viability data is shown for the top-scoring, knockdown-validated AKT1 hairpins (B) and SGK3 hairpins (C) in PIK3CA-mutant lines with high vs. low p-AKT levels. (D) SGK3 expression by immunoblot analysis (left panel) and cell viability (right panel) following lentiviral RNAi knockdown of SGK3 in MCF-7 cells (PIK3CA-mutant, low p-AKT) (NS: non-specific band). Scale bars = 500 μM.

