FIG.3.
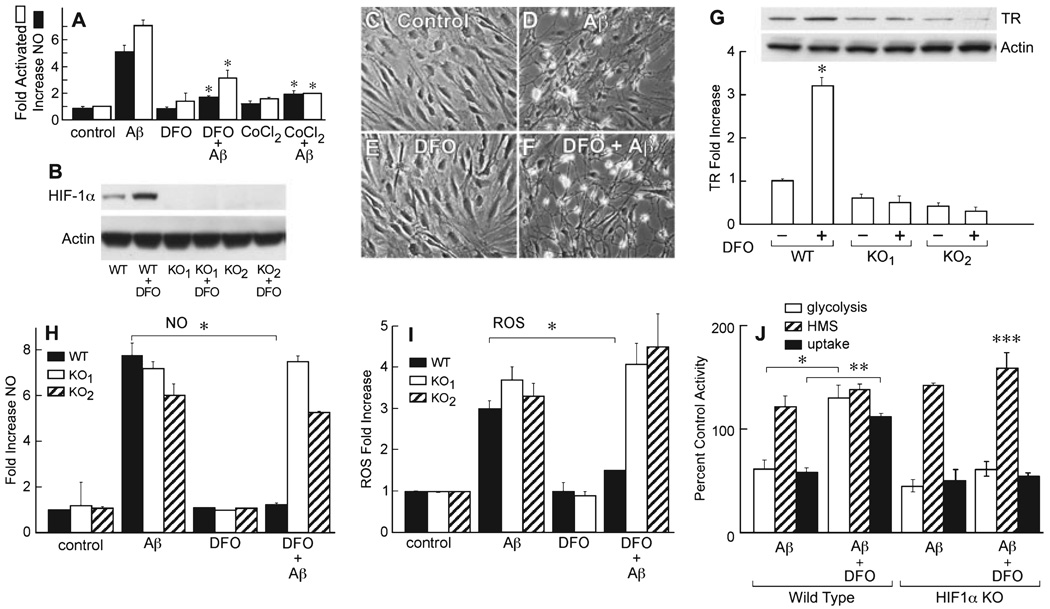
The iron chelator desferoxamine (DFO) prevents amyloid beta peptide (Aβ)-induced activation in wild-type astrocytes, but does not prevent glial activation in hypoxia-inducible factor (HIF)-1α-deficient astrocytes. (A) Astrocyte activation is inhibited by DFO and CoCl2. Nitric oxide (NO) release (black bars) and morphological activation (white bars) were monitored at 8 h post-Aβ exposure, as described in Materials and methods. *Significantly different from Aβ alone for each condition (P < 0.001, n = 8), one-way ANOVA, Tukey’s post hoc test. (B–J) HIF-1α gene knockout glial cells can be activated by Aβ, but are not inhibited by DFO. Western blot of HIF-1α from control and HIF-1α-deleted cultures after 8 h. WT, wild-type cells control. KO1 and KO2, cells from two HIF-1α-deleted animals plus or minus 50 µm DFO. (C) Control, and (D) HIF-1α null cells exposed to 1 µm Aβ1–42 for 8 h. (E) HIF-1α null cells exposed to 50 µm DFO for 8 h alone. (F) HIF-1α null cells exposed to DFO and Aβ for 8 h. Wild-type cells from the same litter were activated by Aβ1–42, and activation was blocked by DFO (data not shown). The phase bright areas in the activated cells (D and F) are contracted cell bodies. (G) Increase in transferrin receptor (TR) amount at 8 h following exposure to 50 µm DFO in wild-type (WT) and cells from the two HIF-1α knockout mice (KO1 and KO2), *P < 0.0001, two-tailed P-value, unpaired t-test (n = 3). (H) NO production in wild-type (black) and KO1 (white) and KO2 (stripes) astrocytes 8 h post-Aβ exposure. Aβ1–42 and DFO concentrations were 1 µm and 50 µm, respectively. *P < 0.0002, two-tailed P-value, unpaired t-test (n = 3). (I) Reactive oxygen species (ROS) production in wild-type (black bars) and HIF-1α KO1 (white bars) and KO2 (stripes) mouse astrocytes determined after 8 h exposure to 50 µm DFO and/or 1 µm Aβ1–42. *P < 0.0016, two-tailed P-value. (J) A comparison of energy metabolism in wild-type and HIF-1α KO astrocytes 24 h after exposure to 50 µm DFO and/or 1 µm Aβ1–42. Glycolysis (white), uptake (black), hexose monophosphate shunt (HMS; hatched). *P < 0.001 for glycolysis; **P < 0.001 for uptake; ***P < 0.0001 for HMS (n = 4) independent cultures from the same animal, vs. control without Aβ, two-tailed t-test.

