
Figure 4.
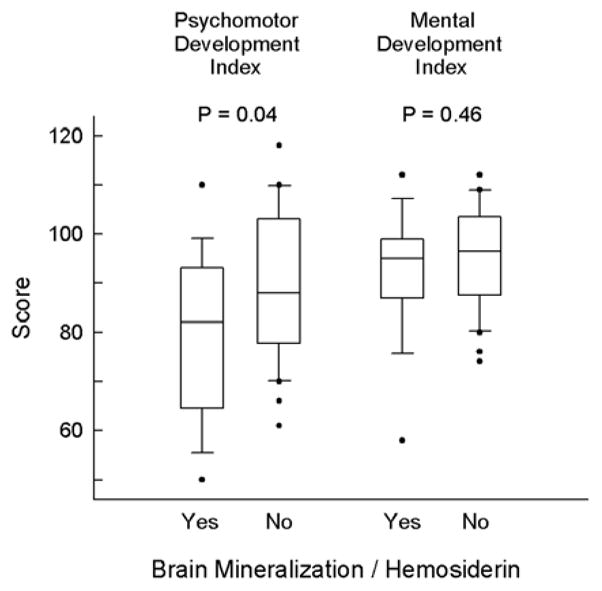
Boxplot of Psychomotor (PDI) and Mental (MDI) Development Index scores for subjects with and without foci of hemosiderin. The limits of the box indicate the 25th and 75th percentiles and the median is marked by the line within the box. The whiskers indicate the 10th and 90th percentiles and the observations outside of this range are shown as solid circles.