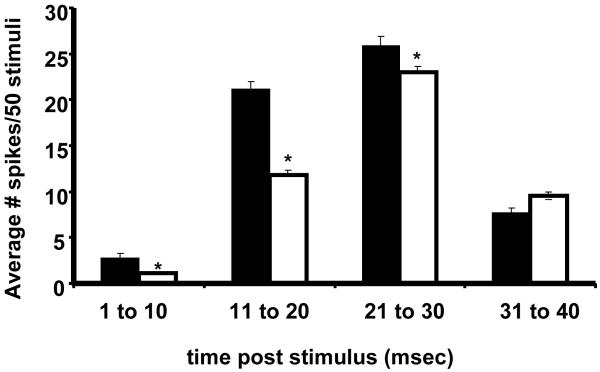
Figure 7. Bar graph of the mean ± SE Stimulus Evoked Activity from Control and B(a)P-exposed (300μg/kg BW) Offspring.
The mean number of spikes (spikes evoked/50 stimuli: y axis) occurring at 10ms epochs (x axis) for the duration of 40ms trial. Black bars represent peanut oil control offspring and white bars represent B(a)P-exposed offspring. Data is derived from a suprathreshold intensity (50 V stimulus applied to piezoelectric element) with whiskers deflected approximately 600 μm from the face. Response magnitudes (+SEM) were assessed for statistical differences within each group (* p<0.05, ANOVA). The epoch analysis shows that prenatal B(a)P exposure significantly impacts the shorter latency components.

