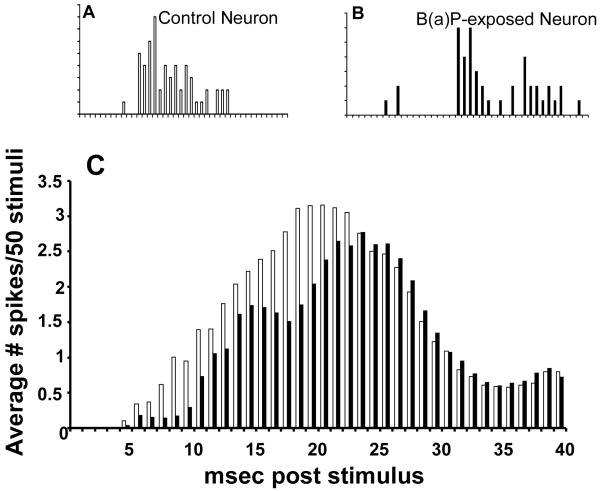
Figure 8. Post-Stimulus Time Histograms Illustrate the Deficit in Short Latency Responses to Whisker Stimulation by S1 Cortical Neurons.
Panel A and Panel B; Responses to a single round of 50 whisker stimulations from Control and B(a)P-exposed neurons, respectively. Panel C; Comparison of average responses from all Control versus all B(a)P-exposed neurons recorded.

