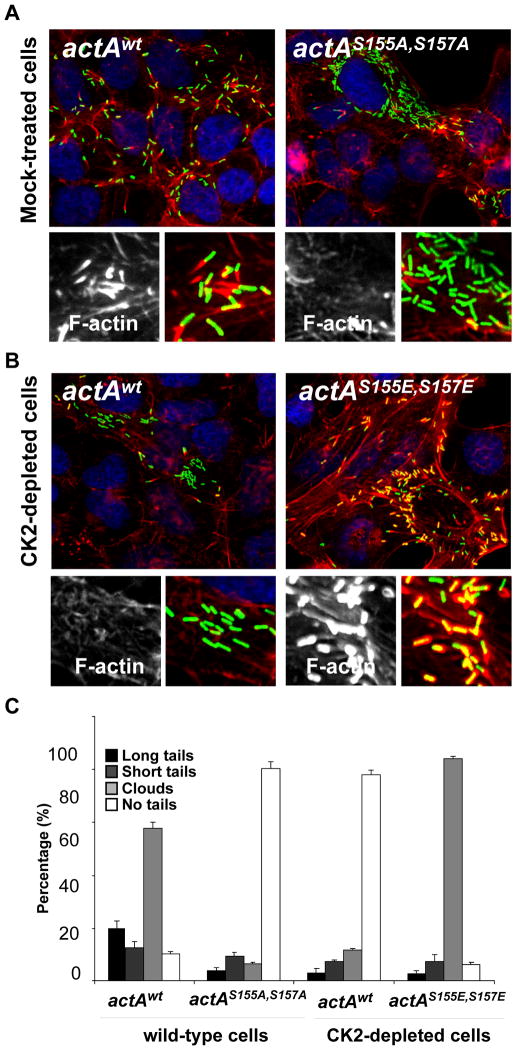
Figure 4. ActA phosphorylation regulates actin tail formation and cell-to-cell spread.
(A and B). Cells infected with GFP-expressing bacteria (green) and stained for DNA (blue) and F-actin (red). The high-magnification images displayed at the bottom of each image show F-actin only (left) and F-actin (red) and bacteria (green) (right). The corresponding spreading index values and +/− SD were determined by image analysis of at least 12 foci of infection in three independent experiments as described in Figures S1: actAwt in mock-treated cells, SI= 9+/−3; actAS155A-S157A in mock-tretaed cells, SI= 4+/−2; actAwt in CK2-depleted cells, SI= 3+/−1 and actAS155E-S157E in CK2-depleted cells, SI= 3+/1. (C) Histogram scoring actin tail formation as presented in A and B. Values represent the mean ± SD of three independent experiments.

