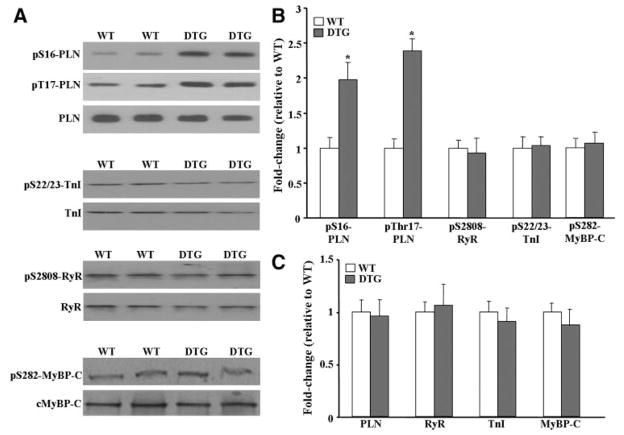
Figure 3.
Ca2+ regulatory phosphoproteins in DTG hearts. A, Immunoblot analysis revealed that phosphorylation of PLN was increased in DTG hearts. No changes were observed in the levels of PLN, ryanodine receptor (RyR), troponin I (TnI), and myosin-binding protein-C (MyBP-C). B, Quantitative analysis of the phosphorylation levels of proteins shown in A, normalized to their respective total protein levels. C, Quantitative analysis of the total protein levels shown in A, normalized to calsequestrin (CSQ). Bars represent means±SEM. *P<0.05 vs WT.

