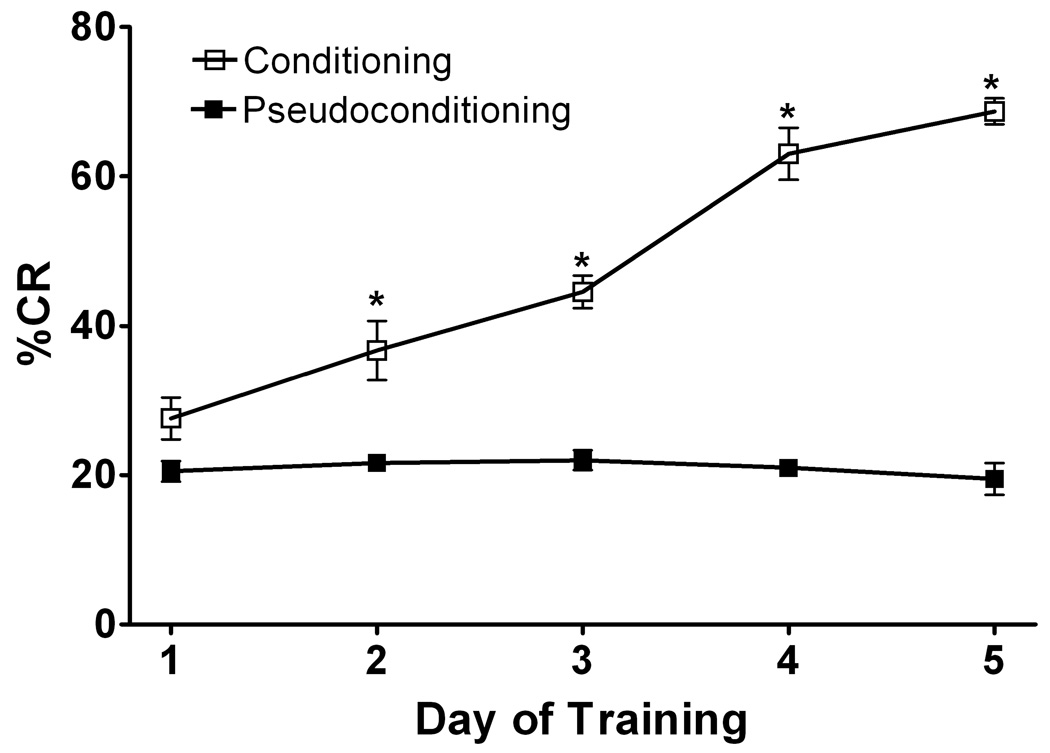
Figure 1. Conditioning vs Pseudo-conditioning: Eyelid Conditioning.
Eyelid conditioning was performed over 5 days. The Y-axis shows the percentage of conditioned response (% CR’s), the x-axis represents daily training sessions of 50 trials. Rats in the conditioning group learned this task over days (represented by higher % CR) whereas rats who under went pseudoconditioning did not learn the task. Open boxes represent conditioning rats with microdialysis probes implanted (N=12), black boxes represent pseudoconditioning rats with microdialysis probes implanted (N=12). Closed triangles represent conditioniong rats with no surgery for microdialysis probe implantation (N=6). The conditioning group learned significantly more than pseudoconditioning rats (F 175.41 [1, 40] p<0.001) and there was no significant difference between rats with or without canula implantation.

